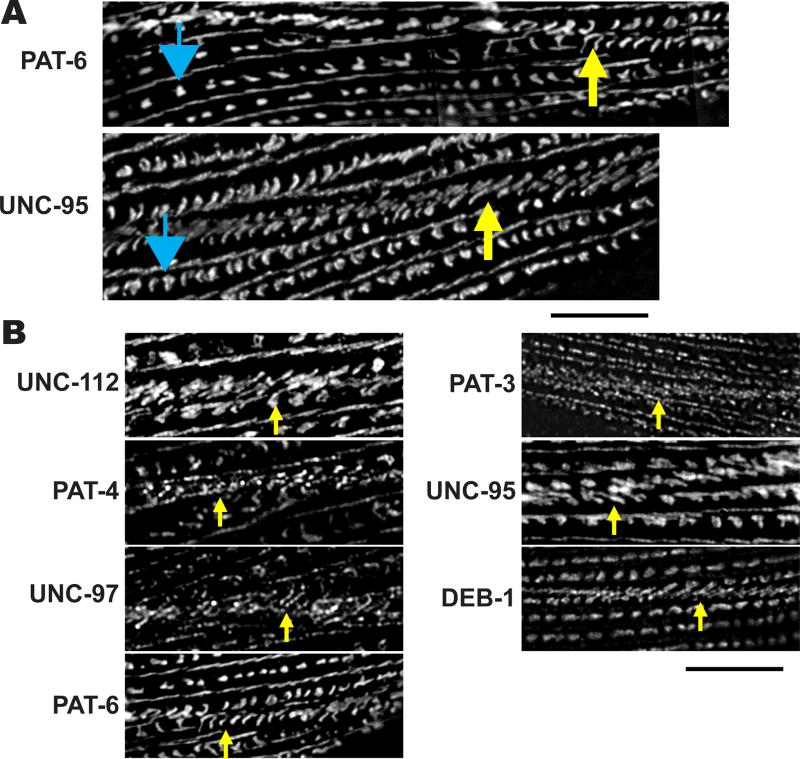
Figure 5. SIM imaging reveals new details about the structure of muscle cell boundaries.
(A) Wild type nematodes were immunostained with anti-PAT-6 and anti-UNC-95 antibodies. Blue arrows point to dense bodies, and yellow arrows point to muscle cell boundary structures. Starting at a dense body indicated with a blue arrow and moving horizontally or slightly diagonally to the right, it appears that the “dot” like dense body structures gradually transition in appearance to the “zipper” like boundary structure indicated with the yellow arrow. Black bar represents 10 µm.
(B) Each panel shows a muscle cell boundary structure indicated with a yellow arrow stained with an antibody to a different protein. Note that all the indicated proteins are part of the “zipper” like structures found at the muscle cell boundary. Scale bar represents 10 µm.

