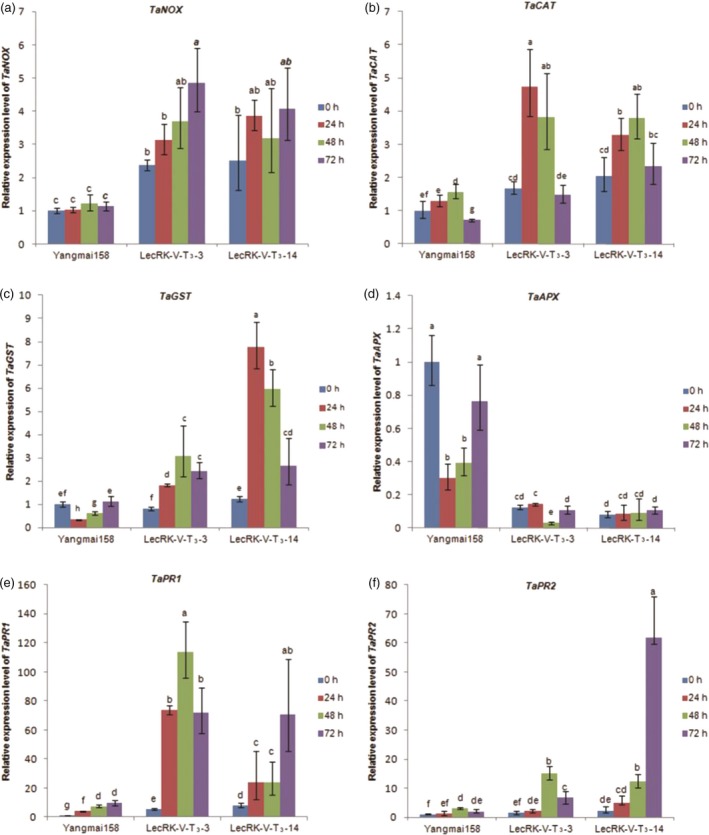
Figure 8.

Relative expression of TaNOX(a), TaCAT(b), TaGST(c), TaAPX(d), TaPR1(e), TaPR2(f) in lines LecRK‐V‐T3–3, LecRK‐V‐T3–14 and Yangmai158 after Bgt inoculation. The qRT‐PCR values were normalized to those for Tubulin and presented as fold changes relative to Yangmai158 without treatment. Three independent experiments were performed, and similar results were obtained; the standard deviation (n = 3) is represented by error bars. Different letters indicate statistically significant differences (P < 0.01, one‐way ANOVA).
