
Figure 2.
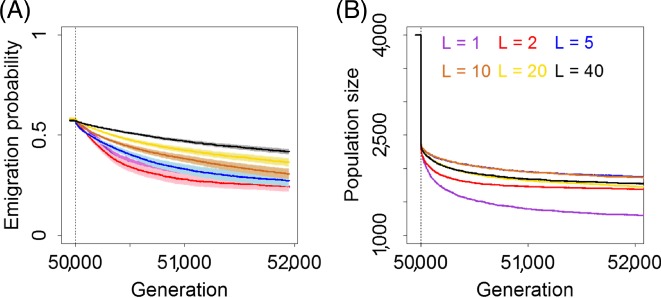
(A) Evolution of dispersal and (B) total population size after a fragmentation event, highlighted by the dashed line at generation 50000. Lines represent the mean and shading, when shown, represents the standard error of the mean of 30 replicates. L = number of loci.