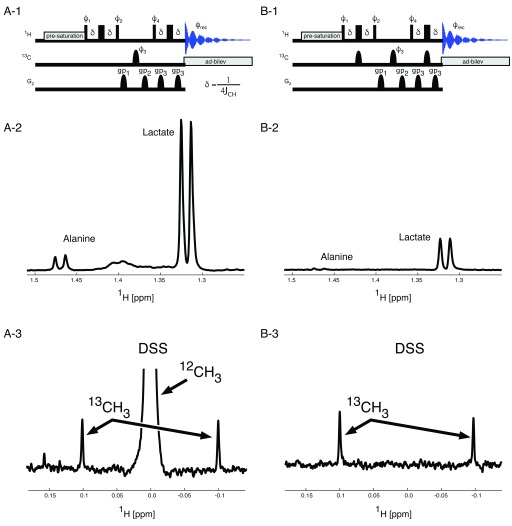
Figure 2. Spectral Filters in 1D spectroscopy.
To determine percentage 13C incorporation two spectra are acquired per sample. One spectrum ( A) contains 1H signals originating from all protons (all 1H spectrum), while the second spectrum ( B) only contains signals from protons attached to a 13C nucleus. The central 13C π–pulse with phase ϕ 3 is executed every second transient in both experiments. The proton magnetisation in the all 1H pulse sequence is the same for 12C and for 13C bound protons and as a consequence, all 1H magnetisation is longitudinal during the interval between 1H pulses with the phases ϕ 2 and ϕ 4. Because of the additional 13C π–pulses in the 13C bound 1H pulse sequence, the magnetisation for the two different kinds of protons develops differently. Here only the 13C bound 1H magnetisation is longitudinal in the interval between the 1H pulses with the phases ϕ 2 and ϕ 4. Therefore, the 12C bound 1H magnetisation can be destroyed using the two pulse field gradients labelled gp 1 and gp 2. A recovery delay of 200 µs was used after each gradient. The central 13C π–pulse with phase ϕ 4 improves magnetisation selection as it is accompanied by phase changes of the 1H pulses and the receiver. All 13C π-pulses are adiabatic Chirp pulses with γB 1max = 10 kHz. 1H, 13C J-coupling is suppressed during acquisition using adiabatic bilevel decoupling (ad-bilev) 21. The pulse phases are: ϕ 1 = x, x, -x, -x; ϕ 2 = x, x, -x, -x for the all 1H spectrum ( A-1) and y, y, y, y for the 13C bound 1H spectrum ( B-1), ϕ 3 = x, y, -x, -y, ϕ 4 = x, -x, -x, x, y, -y, -y, y for the all 1H spectrum ( A-1) and y, -y, -y, y, -x, x, x, -x for the 13C bound 1H spectrum ( B-1). Panels A-2 and B-2 show the peaks from Alanine and Lactate methyl protons in the all 1H spectrum ( A-2) and the 13C bound 1H spectrum ( B-2). The scaling of the two spectra is identical allowing easy determination of the percentage incorporation of 13C metabolites. Panels A-3 and B-3 demonstrate the complete removal of the 12C bound proton signal from the 13C edited spectrum (B-3) leaving only the natural abundance 13C signals to be observed.

