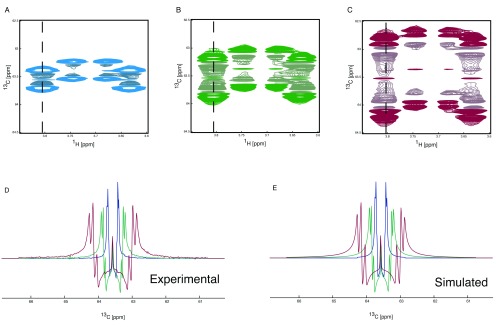
Figure 4. J-coupling splitting enhancement HSQC spectroscopy.
1H, 13C HSQC spectra showing the C(6) of glucose are shown ( A, B and C). The spectrum with no J-coupling splitting enhancement is shown in blue ( A), with an enhancement of two in green ( B) and with an enhancement of four in red ( C). The 13C trace of the HSQC spectra ( D), taken from the 1H frequency as depicted by the dashed line, clearly shows the increase in observed splitting. The J-coupling splitting enhancement is achieved using an additional spin echo subsequent to the 13C evolution period. The delays to achieve the scaling of the splittings are multiples of dw such the use of a delay of 3*dw will result in a J-coupling splitting enhancement of 4 (one from the t 1 evolution and three from the J-coupling splitting enhancement spin echo). The observed splitting can be simulated ( E) giving the following incorporation percentages. From the no J-coupling splitting enhancement spectrum 6.8% / 41.2% / 52 % for [6- 13C] / [5,6- 13C] / [U- 13C], from the two-fold J-coupling splitting enhancement 6.3% / 41.4% / 52.3 % for [6- 13C] / [5,6- 13C] / [U- 13C] and from the four-fold J-coupling splitting enhancement 5.9% / 41.6% / 52.5 % for [6- 13C] / [5,6- 13C] / [U- 13C].

