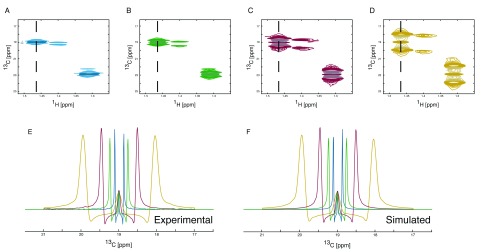
Figure 5. Simulation of J-coupling splitting enhanced spectra.
1H, 13C HSQC spectra showing the C(3) of alanine are shown ( A, B, C and D). The enhancement of J-coupling in the 1H, 13C-HSQC spectra leads to increased separation of coupled peaks and allows the collection of data with reduced numbers of increments in the 13C dimension resulting in shorter acquisition times. The number of points collected in the 13C dimension can be reduced to match the increase in J-coupling enhancement as the loss of resolution will be counteracted by the increase in separation of the coupled peaks. Spectra with no enhancement ( A), two-fold enhancement ( B), four-fold enhancement ( C) and eight-fold enhancement ( D) were collected. The overlay of the differently enhanced spectra clearly shows the effect of the enhancement ( E). The enhancement can be tailored to meet the need in order to maximise separation without significantly increasing signal overlap whilst achieving the maximum reduction in acquisition time possible. The splitting enhancement can easily be included in the simulation parameters ( F) resulting in no adverse effects on the simulated spectra. The simulation gives the following incorporation percentages. From the no J-coupling splitting enhancement spectrum 12.1% / 87.9% for [3- 13C] / [2,3- 13C], from the two-fold J-coupling splitting enhancement 12.0% / 88.0% for [3- 13C] / [2,3- 13C], from the four-fold J-coupling splitting enhancement 12.0% / 88.0% for [3- 13C] / [2,3- 13C] and from the eight-fold J-coupling splitting enhancement 12.1% / 87.9% for [3- 13C] / [2,3- 13C].

