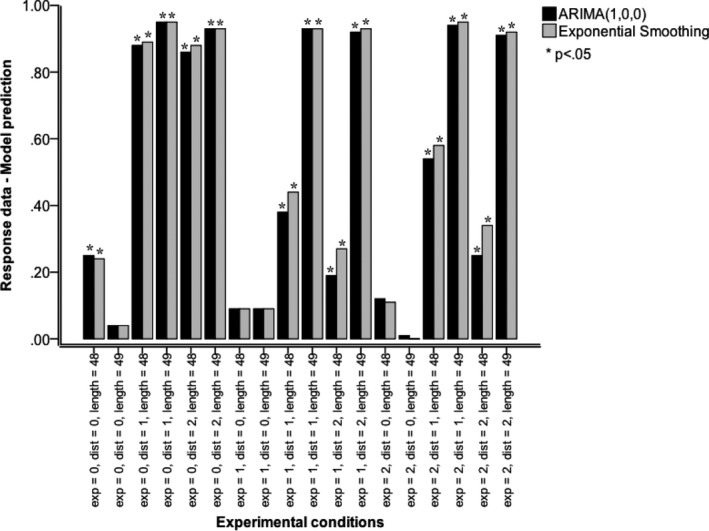
Figure 7.

Effect size r of comparisons between response data (forecasting only) and model predictions (ARIMA and exponential smoothing models). Model comparisons: Exp (presentation mode): 0 static (one simultaneous presentation of all values of a series), 1 historic‐dynamic (self‐paced value‐by‐value presentation of a series with all previous values visible at all times), and 2 momentary‐dynamic (self‐paced value‐by‐value presentation of a series with only the last value visible at any one time). Dist (trend direction): 0 stationary series (Gaussian noise only), 1 positive linear trend with superimposed Gaussian noise, and 2 negative trend with superimposed Gaussian noise. Length (trend consistency): 48 according to Eqs. (1), (2), (3) or 49, where the mean value of 3,500 was inserted at the end of a series of 48—an inconsistent continuation of positive and negative trends.
