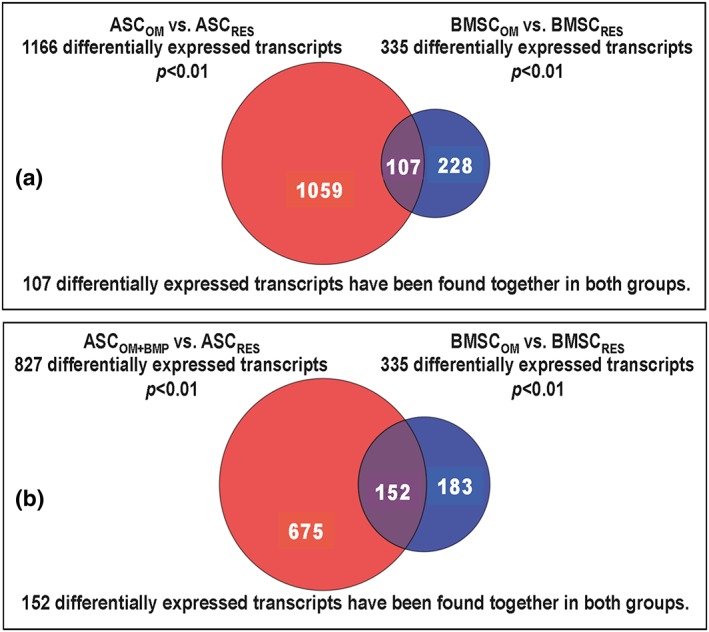
Figure 6.

Micro‐array analysis and multi‐Venn diagram of differential expressed transcripts of adipose tissue stromal cells (ASCs) and bone marrow stromal cells (BMSC) treated with osteogenic differentiation medium (OM) compared with OM supplemented with BMP‐2. (A) Number of significantly changed mRNA expression in BMSCs (blue circle; BMSCOM) and ASCs (red circle; ASCOM) that were osteogenic activated by OM. The suffix RES indicates resting, not osteogenic activated cultures. The intersection represents 107 differentially expressed transcripts found together in both groups. (B) Number of significantly changed mRNA expression in BMSC cultures (blue circle; BMSCOM) that were osteogenic induced with OM, and ASC cultures (red circle; ASCOM + BMP) that were activated with BMP‐2‐supplemented osteogenic medium (OM + BMP). The suffix RES indicates resting, not osteogenic induced cultures. The intersection represents 152 differentially expressed transcripts found together in both groups. [Colour figure can be viewed at wileyonlinelibrary.com]
