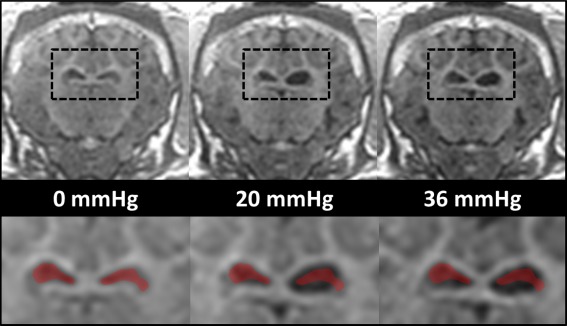
Figure 3.

Anatomical images of ventricles under different pressure levels postcatheter implantation in pig 1 (top row). The black dashed boxes in the top row have been magnified in the bottom row. For comparison purposes, the ventricles at 0 mmHg have been overlaid in red in all three magnified images. mmHg, millimeters mercury.
