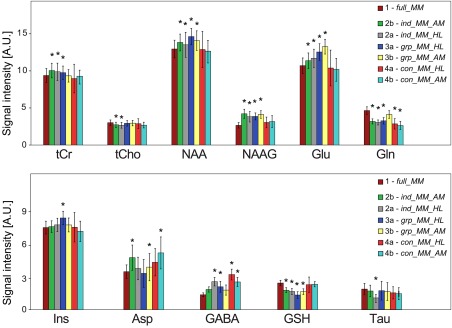
Figure 2.

Comparison of metabolite signal amplitudes quantified using different basis sets. The results obtained using full_MM (MM model 1) were considered a gold standard and compared (repeated measures analysis of variance) to the remaining six basis sets (MM models 2a/b, 3a/b, and 4a/b). (* indicates P ≤ 0.05). The bar plots show the quantified mean metabolite signal intensities ( ± standard deviation) from all volunteers averaged over the whole MRSI slice. A.U., arbitrary unit; Gln glutamine; Glu, glutamate; MM, macromolecule; NAA, N‐acetyl‐aspartate; NAAG, N‐acetyl‐aspartyl glutamate; tCho, total choline; tCr; total creatine.
