
Figure 3.
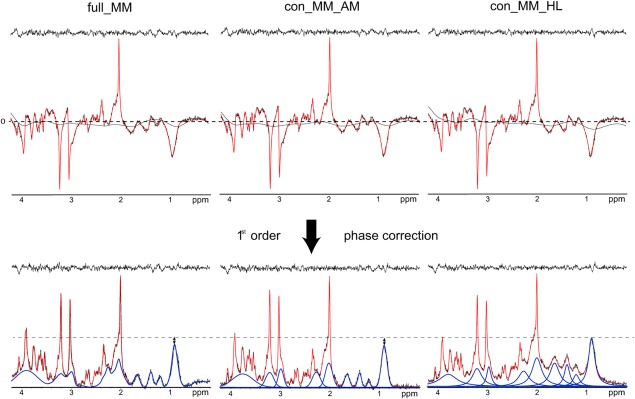
Top: An example of LCModel quantification with full_MM, con_MM_AM, and con_MM_HL, showing 2D‐FID‐MRSI spectrum (black) and fit (red) before first‐order phase correction. Bottom: A corresponding 2D free induction decay MR spectroscopic imaging spectrum (black), fit (red), and fitted MM (blue) quantified using full_MM 1, con_MM_HL (4a), and con_MM_AM (4b) after first‐order phase correction. An elevated baseline is visible in the case of con_MM_HL. The shown spectra originate from a single voxel located in the central part of the slice superior to the lateral ventricles (GMfraction = 60%, WMfraction = 39%)
GM, gray matter; MM, macromolecule; ppm, parts per million; WM, white matter.