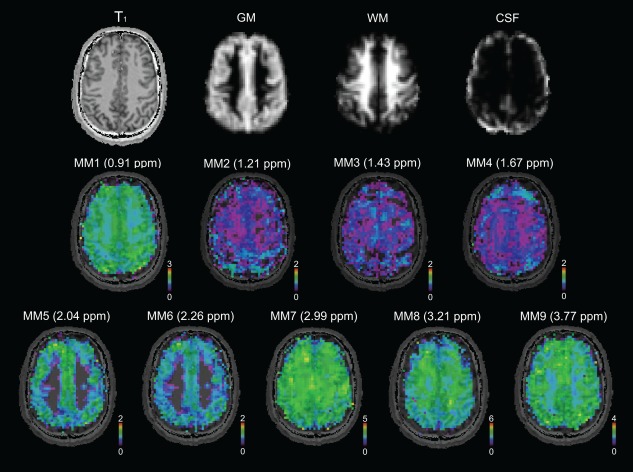
Figure 4.

Maps of nine individual MM components (MM1–MM9) in native resolution (64 × 64 voxels) measured in a volunteer, are shown, together with tissue maps and a T1‐weighted image. Most of the MM resonances tend to be higher in GM compared to WM; only MM8 at 3.21 ppm is higher in WM CSF, cerebrospinal fluid; GM, gray matter; MM, macromolecule; ppm, parts per million; WM, white matter.
