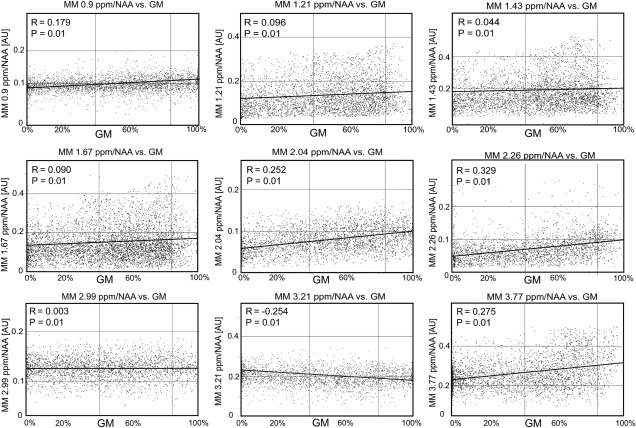
Figure 6.

Scatter plots summarizing the dependence of the macromolecule peaks on the gray matter fraction. Data from all volunteers were used. The lines of best fit for a linear regression model are shown in black. AU, arbitrary unit; GM, gray matter; MM, macromolecule.
