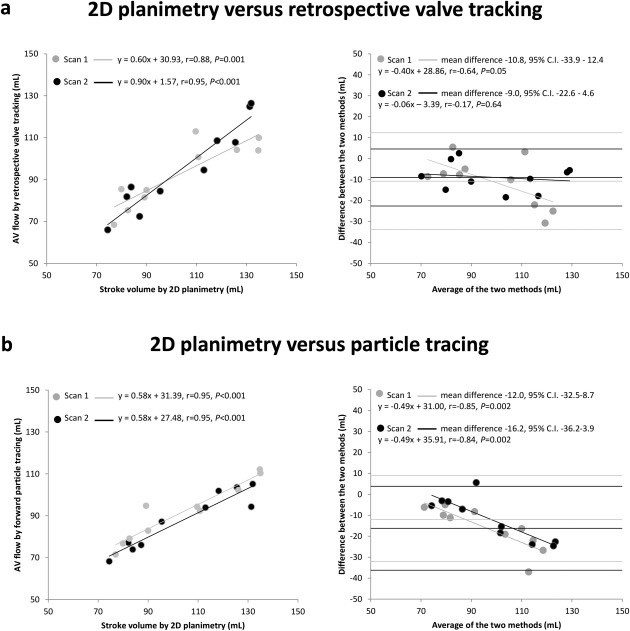
Figure 2.

Scatterplots and Bland–Altman plots for comparison of left ventricular in‐ and outflow by 2D planimetry and 4D flow MRI with retrospective valve tracking and particle tracing (a) Left: scatterplot depicting the correlation between SV measured by 2D planimetry versus AV flow measured by retrospective valve tracking in scan 1 and scan 2; right: Bland–Altman plot depicting the agreement between SV measured by 2D planimetry versus AV flow measured by retrospective valve tracking in scan 1 and scan 2. (b) Left: scatterplot depicting the correlation between SV measured by 2D planimetry versus AV flow measured by forward particle tracing in scan 1 and scan 2; right: Bland–Altman plot depicting the agreement between SV measured by 2D planimetry versus AV flow measured by forward particle tracing in scan 1 and scan 2. The linear regression lines are plotted in the Bland–Altman plots.
