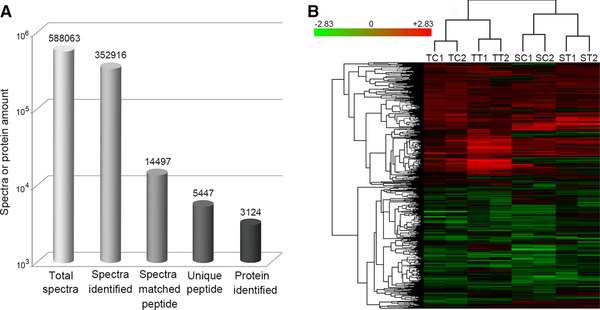
Figure 3.

Results of LC‐MS/MS (A) and cluster analysis for the expressed proteins in the HSL and HTL (B). SC1 and SC2 indicate the duplicates of the controls; ST1 and ST2 indicate the duplicates of the treatments, in the HSL. TC1 and TC2 indicate the duplicates of the controls; TT1 and TT2 indicate the duplicates of the treatments, in the HTL.
