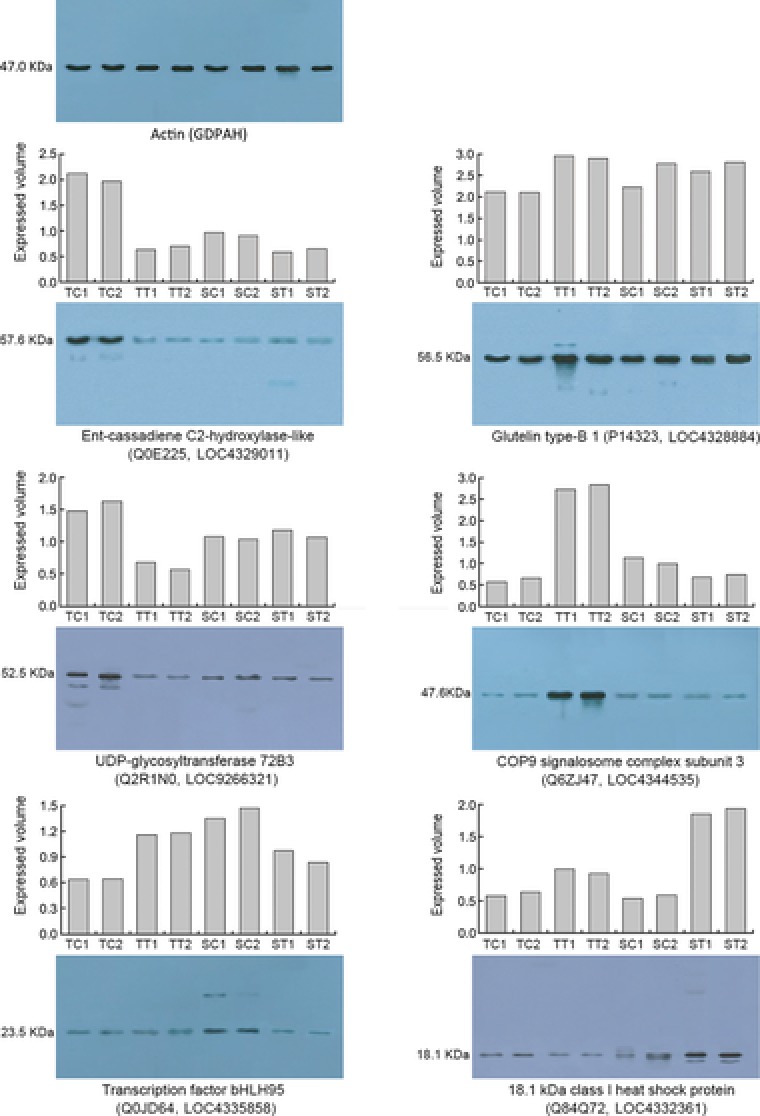
Figure 7.

Expression patterns of six selected proteins based on iTRAQ analysis (histogram) and Western blotting analyses (gel map). SC1 and SC2 indicate the duplicates of the controls; ST1 and ST2 indicate the duplicates of the treatments, in the HSL. TC1 and TC2 indicate the duplicates of the controls; TT1 and TT2 indicate the duplicates of the treatments, in the HTL.
