
Figure 1.
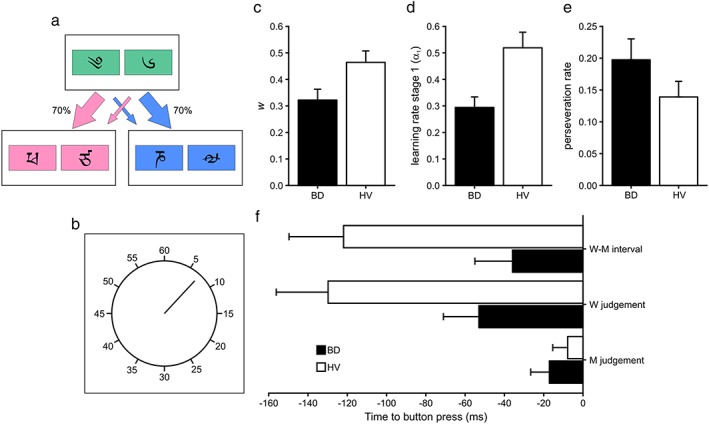
Results from the analysis of the two‐step and Libet clock tasks. Schematic depiction of the (a) two‐step and (b) Libet clock tasks. Mean (c) weighting parameter (w), (d) learning rate in stage 1 (α1) and (e) perseveration rate from the two‐step task. (f) Mean estimated times of intention (W judgement), movement (M judgement) and difference between intention and movement (W–M) relative to the recorded button press from the Libet clock task. Black bars represent binge drinkers (BD) and white healthy volunteers (HV). Error bars represent the standard error of the mean