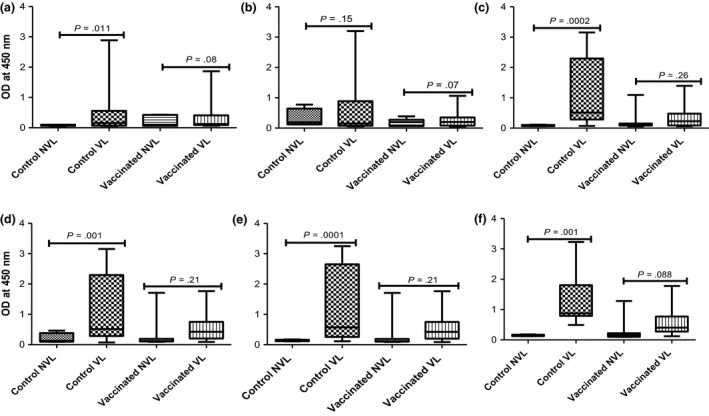
Figure 3.

Kinetics of IFN‐γ response to ESAT6/CFP10 peptide cocktail in vaccinated and control calves with visible lesions (VL) and non‐visible lesions (NVL) groups at various time points post‐exposure to infected herds for one year. The means of IFN‐γ response estimated by optical density (OD) measured at 450 nm were monitored for 12 months after the calves were exposed to the infected herd. The means of the IFN‐γ responses are compared (unpaired t test with Welch's correction) in control calves with VL and in control calves with NVL at the second (a; p = .011), fourth (b; p = .15), sixth (c; p = .0002), eighth (d; p = .001), 10th (e; p = .0001) and 12th (f; p = .001) month post‐exposure to the infected herd. However, although vaccinated calves with VL demonstrated relatively stronger IFN‐γ responses than vaccinated calves with NVL at the different months of exposure, the difference between these two groups was not significant at any of the months
