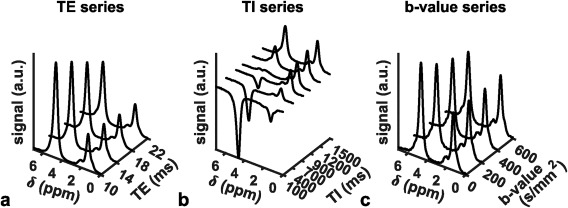
Figure 2.

Vertebral bone marrow MR spectra (15 × 15 × 15 mm3 MRS box at the L5 vertebral body) in a 23‐year‐old female healthy subject with (a) variable T2‐weighting in a STEAM TE series, (b) variable T1‐weighting in an inversion recovery STEAM TI series, (c) variable diffusion‐weighting in a diffusion‐weighted STEAM b‐series. The water peak shows a faster T2 decay, a slower T1 recovery and a faster diffusion attenuation compared to the main fat peak.
