
Figure 5.
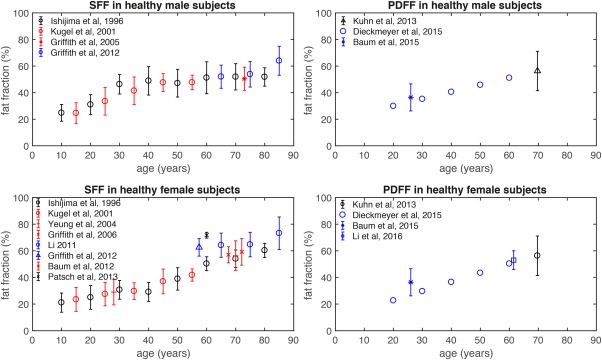
Age dependence of vertebral signal‐weighted fat fraction (SFF) in left column and proton density fat fraction (PDFF) in right column for healthy male subjects (upper row) and healthy female subjects (lower row), as reported in previous studies. Errors bars indicate fat fraction standard deviation.