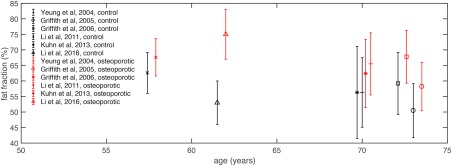
Figure 8.

Comparison of the vertebral fat fraction (SFF and PDFF plotted together) between healthy subjects (control, in black) and osteoporotic subjects (in red) as a function of age in previous studies. Errors bars indicate fat fraction standard deviation.
