
Figure 2.
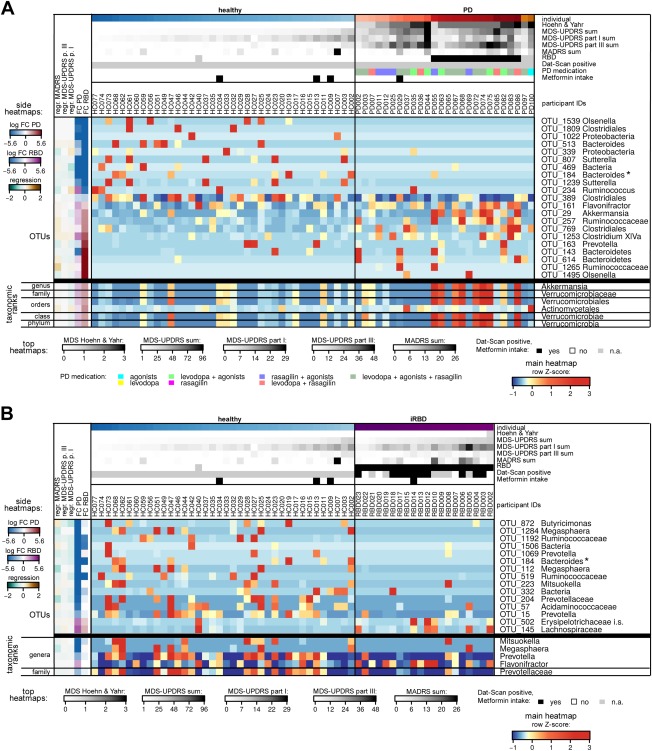
Heatmaps of most differentially abundant taxa in PD patients and individuals with RBD. Relative abundances of prokaryotic OTUs and higher‐level taxa of the gut microbiome that were found to be differentially abundant in (A) PD patients, or (B) iRBD patients or both compared to the HCs (FDR‐adjusted DESeq2 P values < 0.001 and/or confirmation by ANCOM). Legends for the cohort‐related indications at the top of the heatmaps, for the summarizing heatmaps to the left, and for the central heatmaps are given to the left and below the heatmaps (for the complete set of differentially abundant taxa, detailed histograms, summary data, and further explanations, see Supplementary Information). For the OTUs, the lowest confident classifications are displayed; i.s.: incertae sedis; *the Bacteroides OTU_184 was found in both displayed sets. FC, fold change; n.a., not applicable.