
Figure 2.
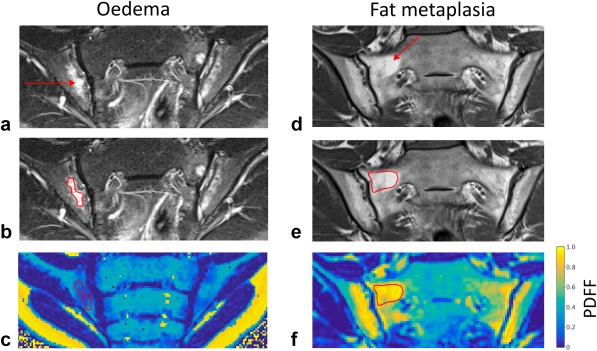
Delineation of edema and fat metaplasia. Areas of bone marrow edema and fat metaplasia were identified on T2‐weighted STIR (a) and T1‐weighted (d) spin echo images, respectively. Freehand regions of interest were placed on these images (b, e) and directly transferred to the corresponding anatomical location on PDFF maps (c, f) using the sacroiliac joints and sacral foraminae as anatomical landmarks. PDFF, proton density fat fraction; STIR, short tau inversion recovery.