
Figure 3.
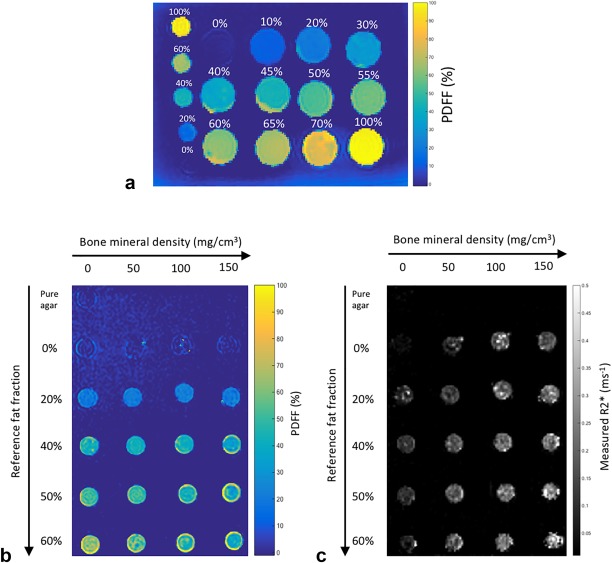
Fat–water and fat–water–bone phantoms. (a) PDFF maps from the fat–water phantom. Labels indicate reference FF values, which vary between 0 and 100%. (b and (c) PDFF and R2* maps from the fat–water–bone phantom. Reference FF values vary by row, whereas bone mineral density values vary by column. FF, fat fraction; PDFF, proton density fat fraction.