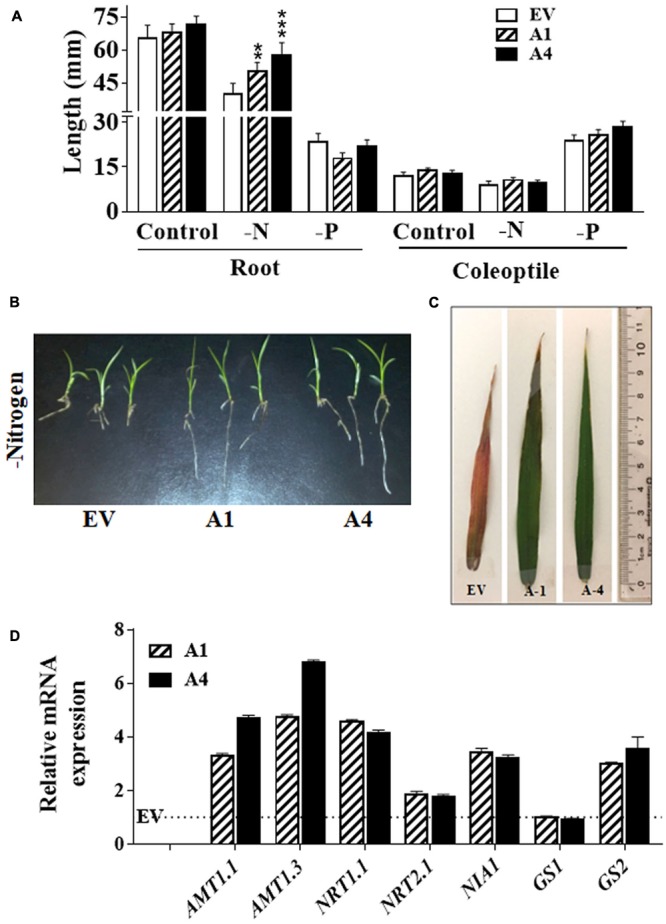
FIGURE 3.

Effect of nitrogen limiting conditions on growth of AGG3OE Setaria plants. (A) Root and coleoptile lengths of 1 week old seedling grown on 0.5 X MS media lacking nitrogen or phosphate sources. The data represent the mean values (±SE) from sixty seedlings. Asterisks represent P-values ≤ 0.01 (∗∗) or ≤0.001 (∗∗∗) as calculated using Students t-test. (B) Representative picture of 2 weeks old seedlings of EV control and AGG3OE lines grown on nitrogen free media. (C) Representative picture of the flag leaf of 5 weeks old EV, A1 and A4 plants under nitrogen-limiting condition. (D) Expression levels of nitrate transporter and metabolism genes in 2-week old S. viridis A1 and A4 plants. Dotted line represents the expression values of the genes (assigned as 1) in EV control plants. The data represent mean values (±SE) of three biological replicates.
