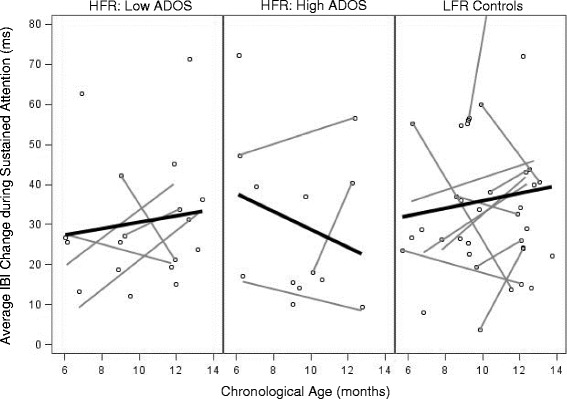
Fig. 3.

Average IBI change during HRDSA across age, separated by ADOS score. Note: Although data were analyzed continuously, “high” ADOS scores in the figure include those in the “mild-to-moderate” and “moderate-to-severe” ranges. LFR group values are displayed for reference. One LFR participant value not pictured to maintain graph scale (IBI change = 130.15 ms at age 12.03 months). Note: gray = nested data for individuals with multiple assessments; black = group regression line
