
Fig. 1.
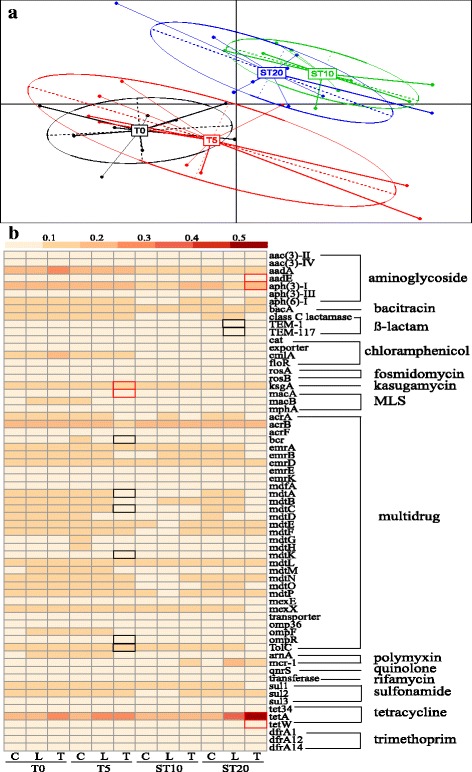
Variations of ARG subtypes in different samples over the course of chlortetracycline administration. a Principal component analysis of ARG subtypes. b Heatmap of variations of ARG subtypes based on the relative abundance of ARG subtypes. Significant (P < 0.05) increases and decreases are shown by border lines of cells colored by red and black, respectively. ARG subtypes with an average abundance > 1% are shown. See Additional file 2: Table S4 for the relative abundances of ARG subtypes