Fig. 2.

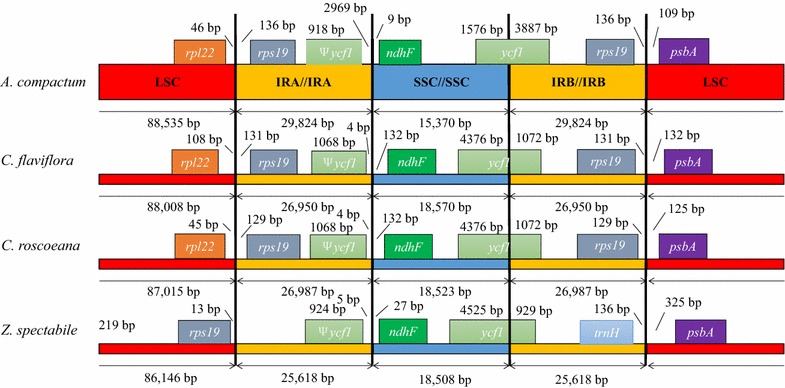
Comparison of the border positions of the LSC, SSC, and IR regions among four complete Zingiberaceae chloroplast genomes. Gene names are indicated in boxes, and their lengths in the corresponding regions are displayed above the boxes

Comparison of the border positions of the LSC, SSC, and IR regions among four complete Zingiberaceae chloroplast genomes. Gene names are indicated in boxes, and their lengths in the corresponding regions are displayed above the boxes