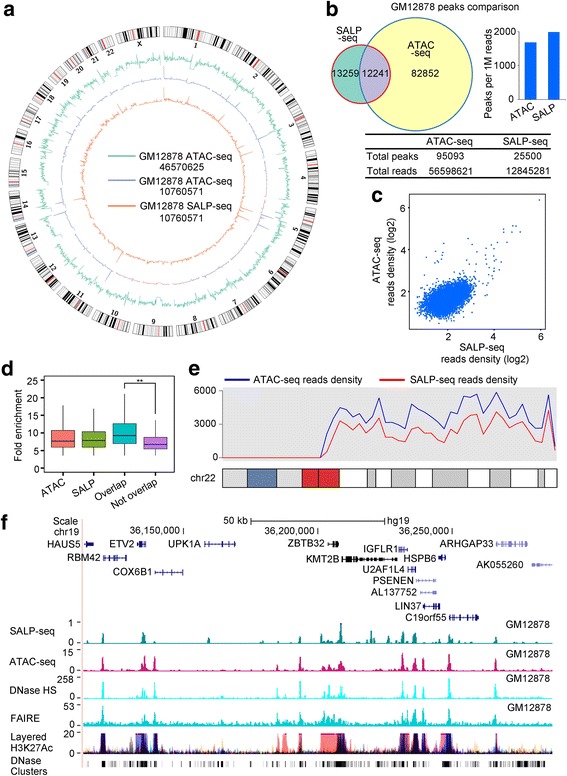
Fig. 2.

Comparative characterization of chromatin openness states of GM12878 cell line by SALP-seq and ATAC-seq. a Distribution of reads density. The reads density refers to the reads number in each 1-Mb window. b Comparison of peaks identified by two methods. c Comparison of reads density of common peaks identified by two methods. d Fold enrichment of various peaks. ATAC, ATAC-seq peaks called with the same amount of randomly selected reads as total SALP-seq reads. SALP, SALP-seq peaks; Overlap, Overlapped ATAC-seq and SALP-seq peaks; Not Overlap, SALP-seq peaks not overlapped with ATAC-seq peaks. e Distribution of reads density on chromosome 22. f UCSC browser track showing chromatin openness state of a selected region characterized by SALP-seq and other methods
