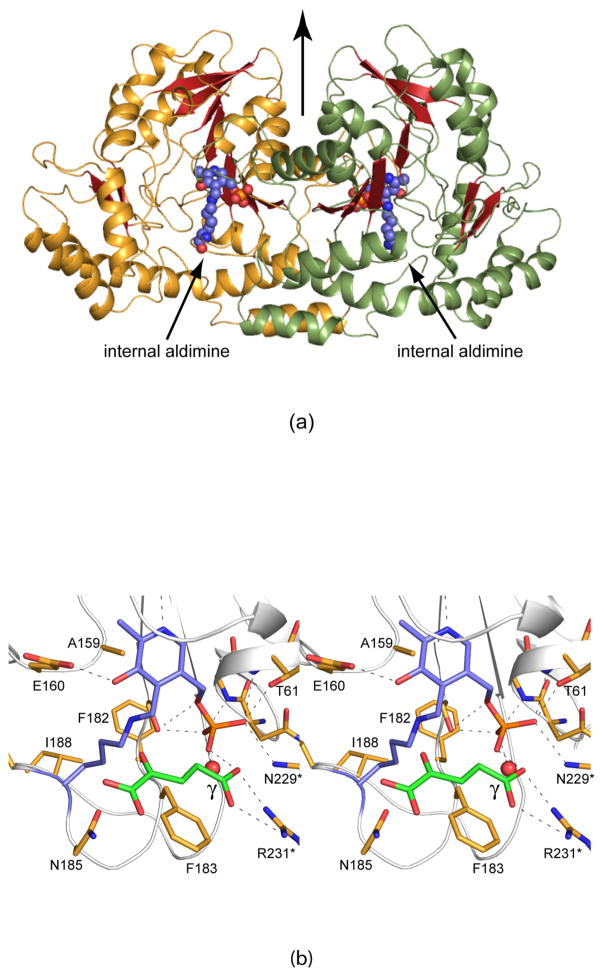
Figure 1.
Molecular architecture of C. crescentus GDP-perosamine synthase. (a) A ribbon representation of the dimer. The initial structure solved contained PLP attached to Lys 186 via a Schiff base (indicated in sphere representation). The local twofold rotational axis relating one subunit to the other lies in the plane of the figure as indicated by the black arrow. (b) Close-up view of the active site. Crystals used for the initial structural analysis of GDP-perosamine synthase were grown in the presence of α-ketoglutarate, and the structure was determined to 1.8 Å resolution. The Lys 186/PLP internal aldimine and α-ketoglutarate are highlighted in slate and green bonds respectively. Possible hydrogen bonding interactions are depicted by dashed lines. All figures were prepared with the software package PyMOL (21).

