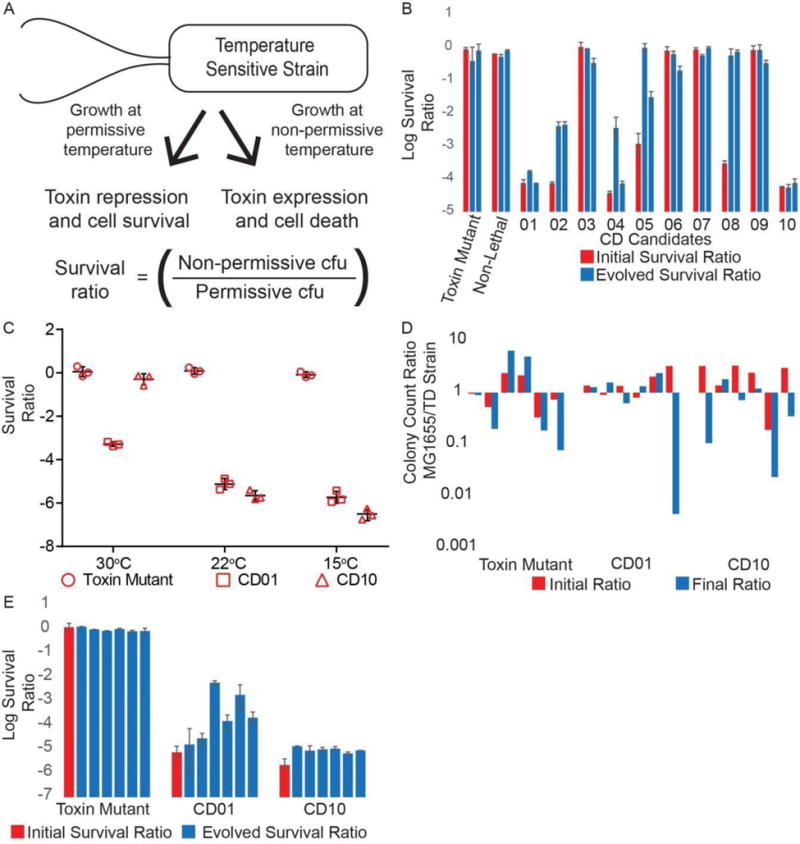
Figure 6. Analysis of cryodeath cadidates.

A) Survival assay used to test the extent of population termination at non-permissive temperatures. B) Survival ratio of the ten temperature sensitive candidates in DH10β (CD1-CD10) before and after 140 generations of growth at a permissive temperature. Data represents average of two technical repeats, with error bars showing range. Two biological repeats after a period of growth are shown. Non-Lethal = CD non-lethal. C) Survival ratio of candidates CD01 and CD10 in MG1655 at 30 °C, 22 °C, and 15 °C. Three technical repeats of each condition are shown. D) Six biological repeats of a competitive growth assay of 70 generations to compare the fitness of parental (MG1655) and engineered bacterial strains. E) Six biological replicates of survival ratio of candidates CD01 and CD10 in MG1655 after 140 generations, each biological replicate data point is the average of 3 technical replicates plotted with 3 technical repeats. Initial survival ratios are from the data collected for Figure 6C. See also Figure S4 and Table S5.
