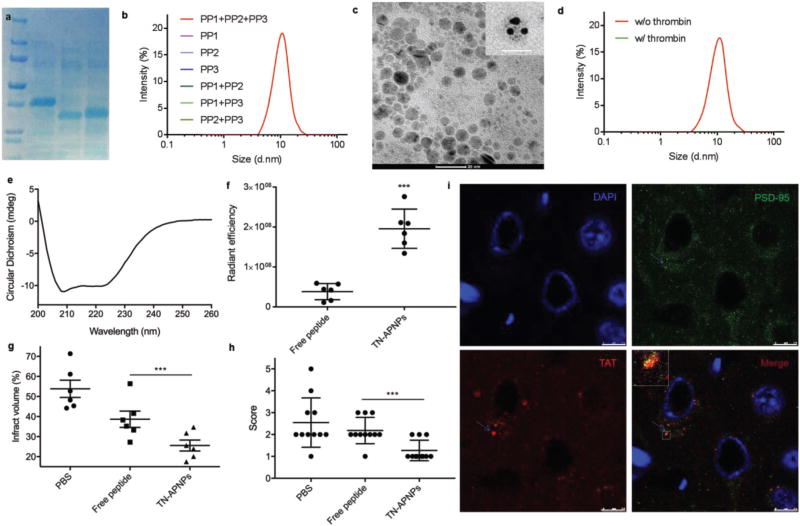
Figure 2.
Formulation, characterization, and evaluation of TN-APNPs. a) Expression and purification of polypeptides. b) DLS analysis revealed that only three polypeptides, but not individual ones, form APNPs. c) A representative TEM image of TN-APNPs and close-up views of individual APNPs stained with 5 nm Ni-NTA–nanogold beads (insert) Scale bar: 20 nm. d) DLS analysis of the secondary structure of TN-APNPs. e) TN-APNPs were dissembled after thrombin treatment. f) In vivo quantitative distribution of Tat-NR2B9c in the ischemic region after delivery in form of free peptide or APNPs. Both free Tat-NR2B9c and TN-APNPs were labeled with AF750. Each MCAO rat received the same amount of AF750 immediately after surgery. 24 h later, rats were euthanized. The brains were harvested and subjected to IVIS imaging. Fluorescence intensity in the ischemic region was determined using Living Image 3.0. Fluorescence unit determined by IVIS was expressed as radiance efficiency [(photons s−1 cm−2 sr−1)/(µW cm−2)]. g) Infarct volumes in rats received indicated treatments. The ischemic region was identified by TTC staining and quantified by ImageJ (NIH). h) Neurological scores of MCAO rats receiving indicated treatments at day 3 after surgery. i) Confocal analysis of the interaction of PSD-95 and Tat-NR2B9c in a representative ischemic region. PSD-95 and Tat-NR2B9c were identified by an anti-PSD-95 antibody and an anti-TAT antibody, respectively. Scale bar: 7.5 µm.

