
Exhibit 4. Relationship Betweeen Differences in Wait Times and Reimbursement Rates Between Medicaid and Private Insurance, by State.
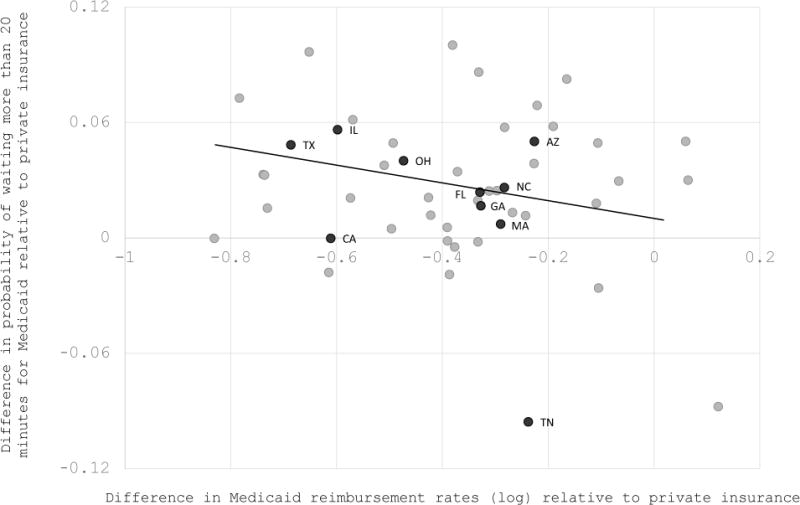
Source/Notes: SOURCE Author’s analysis of data from athenahealth NOTES Figure plots the difference in relative Medicaid wait time against relative Medicaid log reimbursement rates. The former is computed by regressing an indicator variable for waiting more than 20 minutes on state identifiers interacted with insurance type, controlling for age bins, gender, (natural) log RVUs, day of the week, time of day, arrival time, and physician specialty. The difference was then calculated by subtracting the coefficient on private insurance for a given state from the coefficient on Medicaid insurance for that state. The latter was computed in an analogous way, using (natural) log “allowable charges” as the dependent variable. Each point represents a state. The number of Medicaid visits by state ranged from 4,570 (Alaska) to 2,214,899 (Texas); we labeled the ten states with the most Medicaid visits. The dashed line is the best-fit line, weighted by the number of Medicaid visits, and its estimated slope is −0.041 (P < 0.001).