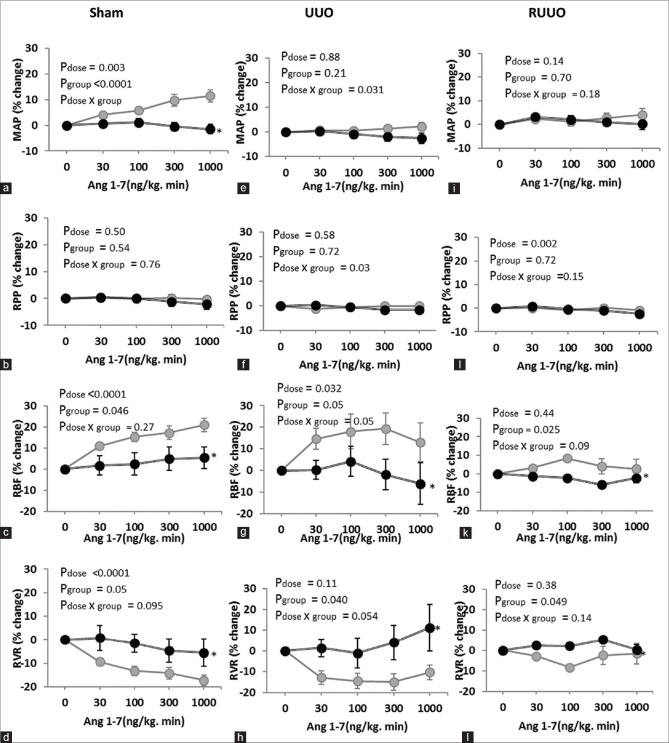
Figure 2.
(a-l) The percentage changes of the MAP, RPP, RBF, and RVR in vehicle or A779 administration rats’ responses to graded Ang 1-7 infusion in sham or UUO or RUUO models. Data are presented as mean ± standard error of the mean of percentage changes from baseline. The P values were derived from repeated-measure ANOVA. ∗: Represents significant difference from the vehicle. UUO: Unilateral ureteral obstruction, RUUO: UUO removal, MAP: Mean arterial pressure, RPP: Renal perfusion pressure, RBF: Renal blood flow, RVR: Renal vascular resistance

