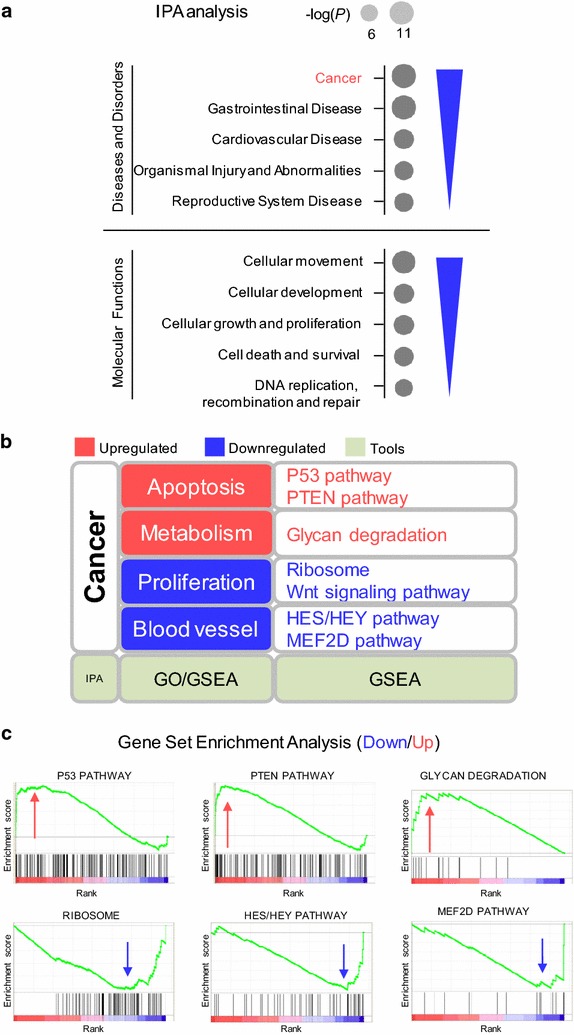
Fig. 4.

Bioinformatics analyze of RRS1 knock-down cells revealed dramatic alterations of transcriptome in the thyroid cancer cells. a Dot plots of gene ontology terms enriched on RRS1 knock-down upregulated genes (top panel, red) and downregulated genes (bottom panel, blue) were shown in dots scaled by − log10 (P). b Example gene set enrichment analysis of genes altered in RRS1 knock-downs. Top panel: Ribosome related genes had a significant negative normalized enrichment score (NES) upon RRS1 knock-down. Middle-up panel: HES/HEY pathway related genes had a significant NES upon RRS1 knock-down. Middle-down panel: MEF2D pathway related genes had a significant NES upon RRS1 knock-down. Bottom panel: Glycan degradation gene set had a significant positive NES upon knock-down of RRS1. c Summary of microarray assay by multiple bioinformatics tool
