Fig. 5.

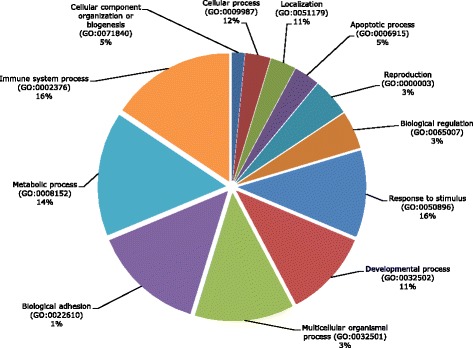
Distribution of the GO “Biological Process” (BP) categories for genes represented by the significantly associated SNPs in GWAS for PVL and WBC counts

Distribution of the GO “Biological Process” (BP) categories for genes represented by the significantly associated SNPs in GWAS for PVL and WBC counts