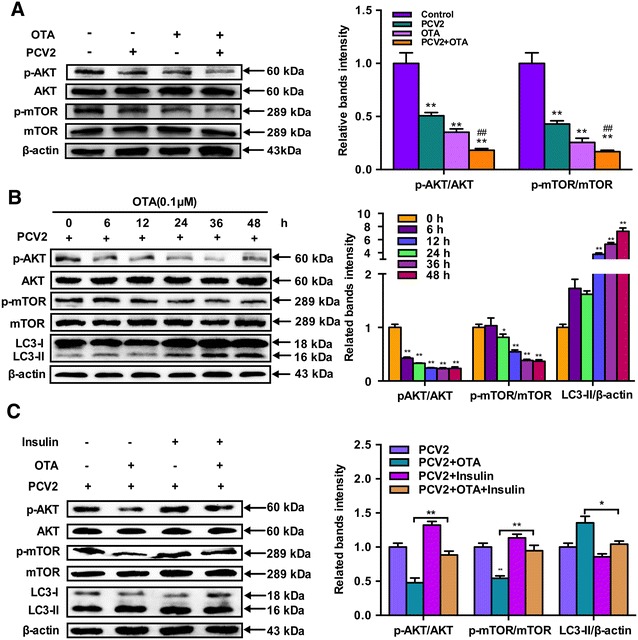
Figure 4.

OTA treatment induce autophagy by suppressing AKT/mTOR signaling pathway. A PK-15 cells were infected with PCV2 for 24 h then incubated with 0.1 μM OTA for 48 h. Cells were harvested and the expressions of p-AKT, AKT, p-mTOR, mTOR, LC3 and β-actin were analyzed by Western blotting as described in Materials and methods. Data are presented as mean ± SE of three independent experiments. Significance compared with control, *P < 0.05 and **P < 0.01. Significance compared with PCV2, #P < 0.05 and ##P < 0.01. B PK-15 cells were infected with PCV2 for 24 h then incubated with 0.1 μM OTA. Cells were harvested at the indicated time and the expressions of p-AKT, AKT, p-mTOR, mTOR, LC3 and β-actin were analyzed by Western blotting as described in Materials and methods. Data are presented as mean ± SE of three independent experiments. Significance compared with control, *P < 0.05 and **P < 0.01. C PK-15 cells were infected with PCV2 for 24 h then incubated with 0.1 μM OTA in the presence or absence of 100 μg/mL insulin for 48 h. After harvest, the expressions of p-AKT, AKT, p-mTOR, mTOR, LC3 and β-actin were analyzed by Western blotting as described in materials and methods. Data are presented as mean ± SE of three independent experiments. *P < 0.05 and **P < 0.01.
