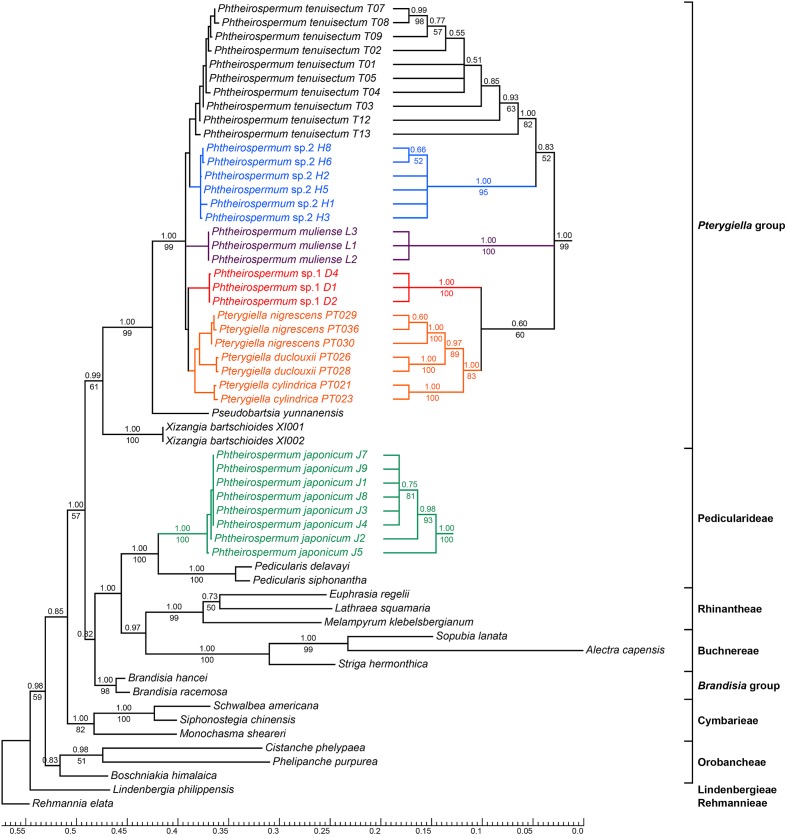
FIGURE 3.
Bayesian inference (BI) tree inferred from the nrITS dataset. ML Bootstrap values are presented under branches, and BI posterior probabilities are shown above branches. The topology of some clades with short branch lengths appear on the right. The bottom scale bar represents the number of substitutions per site.

