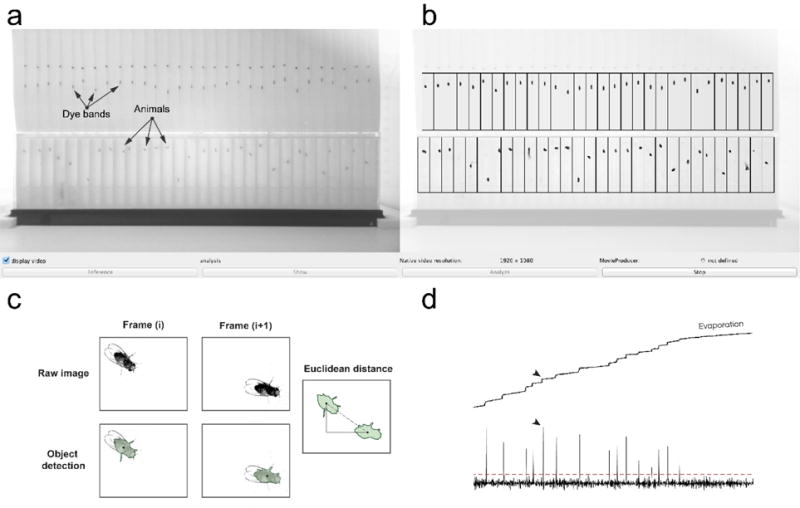
Figure 3. ARC data capture.

(a) Image of the ARCController.java visual interface. Image is a camera view of dye bands and animals. Black markings above dye bands are calibration marks and should be excluded from tracking region. (b) Visual overlay of user-defined tracking regions over original image. Outlines of detected animals are displayed as black outlines with green fill. (c) Animal motion is calculated using Euclidean distance between coordinates of each frame (panel replicated from Murphy et al., eLife 2016). (d) 24-hour trace of the dye band from one capillary using 1-min averages. Motion events are observed (black arrows) which exceed a statistical cut-off (red dashed line), and are defined as meals. Evaporation is evident between meals as the slight continuous increase in baseline.
