
Fig. 3.
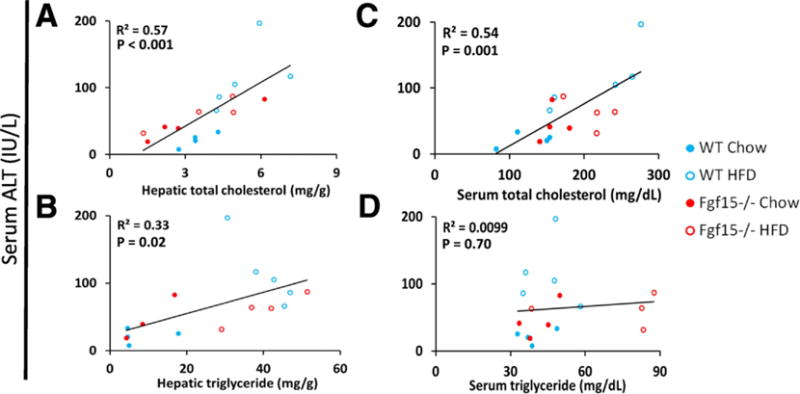
Strong linear correlation between hepatic and serum cholesterol content and serum ALT. Linear regression analysis comparing serum ALT to serum and hepatic total cholesterol and triglycerides was performed. Displayed p-values were calculated by F-test. The scatterplots include datum points from all study animals and are colored based on the group of the respective mouse.