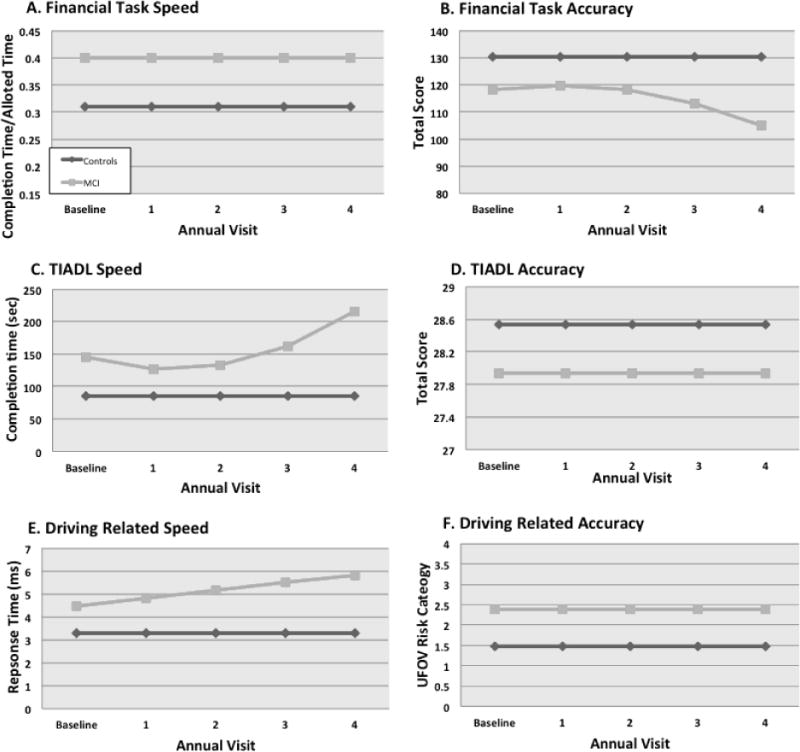
Figure 1.

A–F. Estimated longitudinal trajectories of change in speed and accuracy of performance on measures of everyday function.
Notes. Financial task speed and accuracy measured with four domains of the Financial Capacity Instrument; TIADL, Timed Instrumental Activities of Daily Living; Driving related speed measured with Road Signs Test; Driving related accuracy measured with the Useful Field of View Risk Categories; Values are derived from linear mixed-effects models of the complete sample (n=160) adjusted for significant factors including age, time, baseline diagnosis, baseline diagnosis × time interaction, and baseline diagnosis × time2 interaction. Age was centered at the mean, 69.57 years. For speed measures (A, C, E), higher scores indicate slower performance. For accuracy measures (B, D), higher scores indicate better performance, while for UFOV Risk (F) higher scores indicate greater driving risk.
