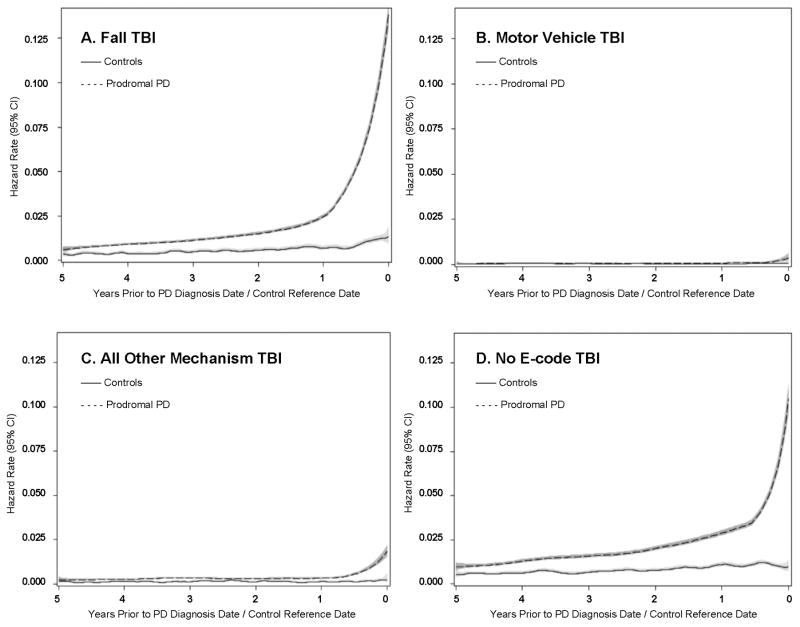
Figure 2. Traumatic Brain Injury Hazard Rate Function by PD Case Status and Mechanism of Injury.
Hazard rate for TBI due to mechanism of injury in unadjusted models smoothed using the Epanechnikov Kernel with gray regions representing the 95% confidence intervals. The PD-TBI-time interaction was most apparent for TBIs from falls (Figure 2A) compared to any other mechanism of injury (Figure 2B. Motor Vehicle TBI and Figure 2C. All Other Mechanism TBI). Figure 2D presents all TBI in prodromal PD cases compared to controls without a recorded mechanism of injury.

