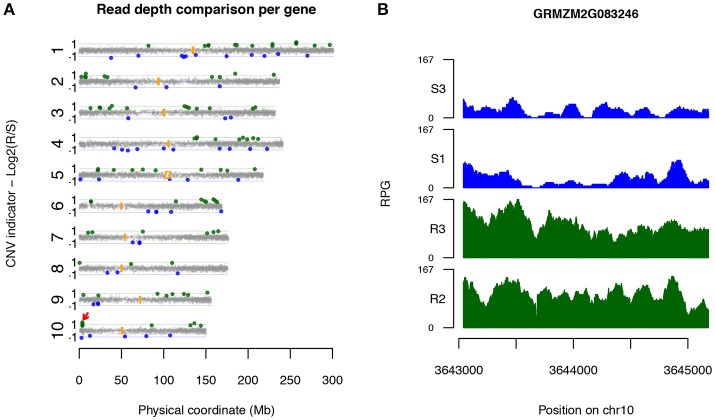
Figure 2.
Candidate disease-associated genes identified via XP-CNV. (A) A genome-wide view of the distribution of sequencing depth comparison between highly R pools and highly S pools across 10 maize chromosomes. Each dot designates a gene. Y-axis represents log2 values of ratios of read depths of R to S, signifying CNV between R and S pools. Genes with statistically significantly higher and lower read depths of R vs. S pools were interpreted as Up-CNV (green) and Dn-CNV (blue), respectively. Orange boxes indicate centromeric positions. Red arrow points to the rp1 locus. (B) Read depths (reads per gigabit total aligned reads, RPG) across the Up-CNV gene GRMZM2G083246 from the pools of two highly R (R2 and R3) and two highly S (S1 and S3) pools.

