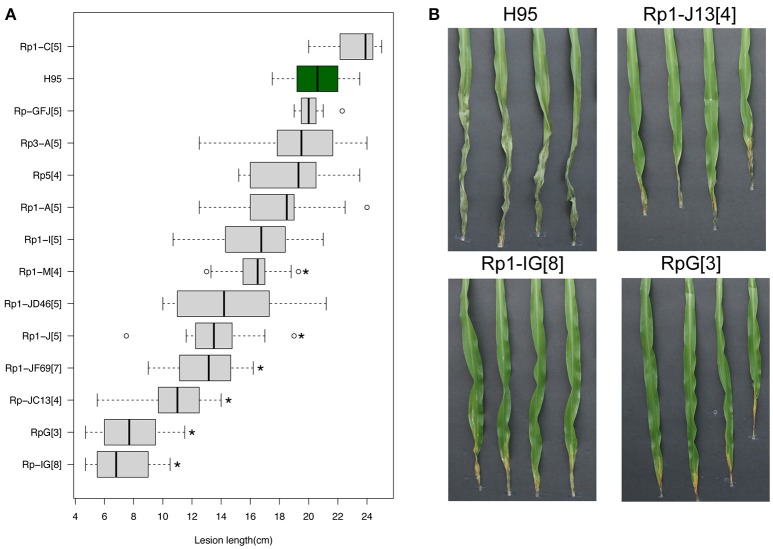
Figure 4.
Effects of multiple Rp1 accessions on disease resistance. (A) Distribution of lesion lengths at 13 DPIs in multiple Rp1 accessions of which the rp1 locus was introgressed into the inbred line H95. In the boxplot, the vertical line within each box indicates a median of lesion lengths. Asterisks indicate statistically significant differences between H95 and an Rp1 accession (t-test, *p < 0.001). (B) Goss's wilt phenotype of H95 and three Rp1 accessions, RpG (an Rp1 haplotype), Rp1-IG, and Rp1-JC13, at 13 DPIs with a Cmn strain. Numbers in square brackets indicate the times of backcross generations.

