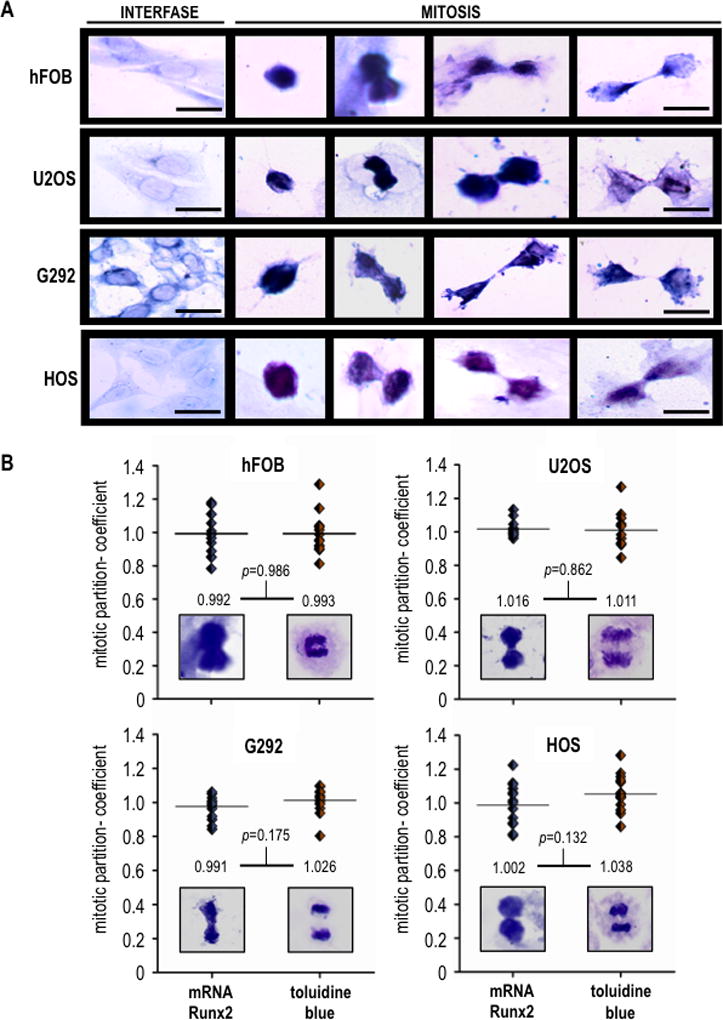
Fig. 4. Runx2 mRNA partitions equivalently in progeny of osseous cells following cell division.

(A) Osteoblastic cell (hFOB) and osteosarcoma cells (U2OS, G292 and HOS) were subjected to RISH analysis. Scale bars: 20 µm, 100X oil objective, numerical aperture = 1.25. (B) Runx2 RISH signal intensity was determinede by quantitative image analysis in progeny cells at the last step of cytokinesis (n=10). Runx2 mRNA (RISH, left image) exhibits a partitioning coefficient equivalent to that of DNA (mitotic chromosomes staining, right image), demonstrating that this transcript segregates symmetrically in progeny cells upon cell division. Student’s t test was performed to assess the significance of the observed differences.
