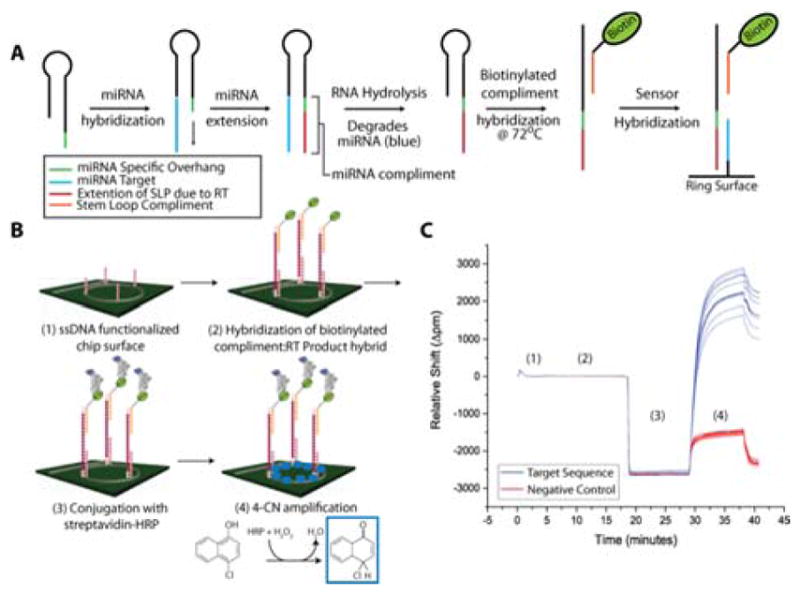
Figure 1.

A) Schematic diagram of miRNA processing to prepare for on chip detection. B) Illustration of RT product detection and HRP signal amplification. C) The representative binding curve shows data corresponding to the detection of a 10 picomole miRNA-26a sample subjected to the workflow in A and B. The large signal gain at 30 minutes is obtained from the 4-chloro-1-napthon deposition.
