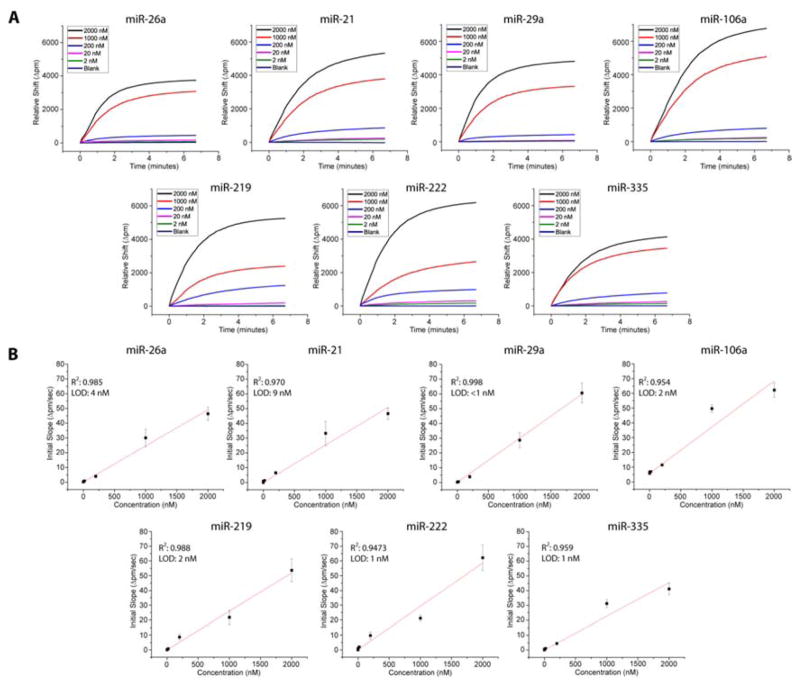
Figure 2.
A) Overlay of the signal responses achieved for each concentration dilution of target miRNA cDNA product. Initial concentrations utilized were: 2 μM (black) , 1 μM (red) , 200 nM (blue) , 20 nM (pink) , 2 nM (green) , and a blank (purple) . B) Calibration curves for the HRP response of each miRNA target. The red curves represent linear fits of the initial slope of the HRP amplification step. Error bars represent the standard deviation of between 8 and 20 technical replicates at each concentration.

