
Fig. 3. C-TSHR-mAb fails to induce endosomal maturation in thyrocytes.
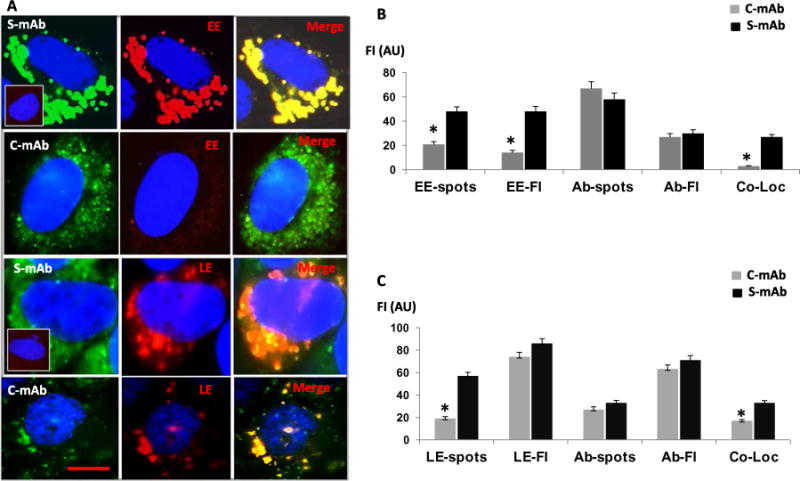
(A) Representative live-cell images of early endosomes (EE; red) induced by S-TSHR-mAb (green) or C-TSHR-mAb (green). The top panel inset shows that no induction of EE formation occurred in the absence of antibody. Representative live-cell images of late endosomes (LE; red) are shown in the bottom two panels. Inset (third row, left column) shows the lack of induction of LE formation in the absence of antibody. Scale bar, 100 μm. (B) EE-spots, EE-FI, Ab-spots, Ab-Fl, and Co-Loc (colocalization) by TSHR-mAbs were quantified by image analysis software and expressed in arbitrary units. *P < 0.005 compared to S-mAb. (C) LE-spots, LE-FI, Ab-spots, Ab-Fl, and Co-Loc in TSHR-mAb–treated thyrocytes were also quantified. Data are means ± SEM of three independent experiments with at least three images per experiment analyzed. *P < 0.005 compared to S-mAb.