
Fig. 5. C-TSHR-mAb induces fewer vesicular proteins.
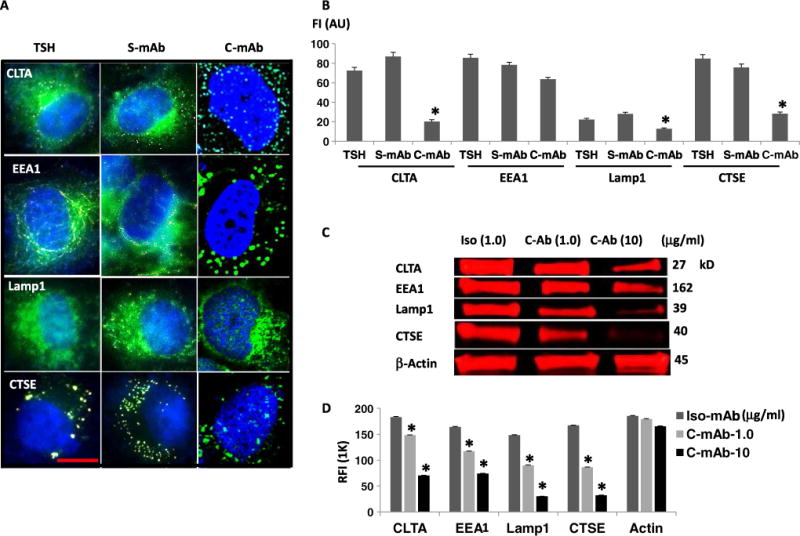
(A) Immunohistochemical analysis of clathrin light chain (CLTA), EE (EEA1), LE (Lamp1), and cathepsin E (CTSE) after the exposure of thyrocytes to TSH or the indicated antibodies for 24 hours. Scale bar, 100 μm. Images are representative of three independent experiments. (B) The relative abundances of CLTA, EEA1, Lamp1, and CTSE in cells treated with the indicated reagents were then quantified by image analysis and expressed as FI in arbitrary units. Data are means ± SEM of three independent experiments. *P < 0.03 compared to S-mAb. (C) LI-COR Western blot analysis of cells after exposure to isotype control mAb [hamster immunoglobulin G2 (IgG2), κ chain] or the indicated concentrations of C-TSHR-mAb. Western blots are representative of three independent experiments. (D) Quantification of the relative FI (RFI) of the bands in the Western blots represented in (C) with Image Studio software. Data are means ± SEM of three independent experiments. *P < 0.008 compared to the isotype control mAb.