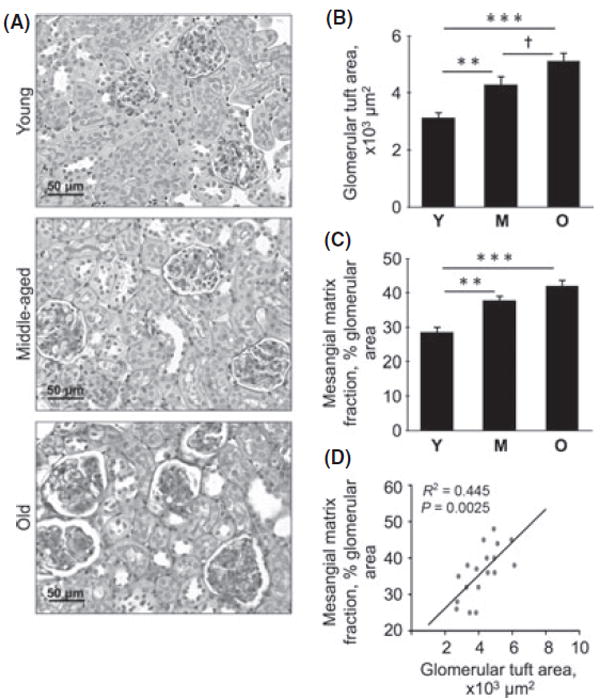
Fig 2.

Glomerular area and mesangial matrix fraction in young (Y), middle-aged (M), and old (O) mice. Kidney sections were stained with PAS (A), and glomerular area (B) and mesangial matrix fraction of the glomerulus (C) were measured by computer-aided morphometry. Representative micrographs from six mice in each of the three age groups are shown. Composite mean ± SE data from six mice in each group are shown in a histogram (**P < 0.01, ***P < 0.001 vs. young mice; †P < 0.05 vs. middle-aged mice by ANOVA). (D) Correlation between glomerular tuft area and mesangial matrix fraction of the glomerulus.
